EDUCATE: The DataSETUP Conceptual Framework
Our EDUCATE (Empowering Data Science Understanding for Teacher Education) framework development drew on the systematic literature review and cycles of framework development with partners in the Erasmus+ research project. The framework is targeted at two audiences:
- Preservice teachers. Preservice teachers do data science from a learner’s perspective. For this audience, the framework is about doing data science.
- Instructors of preservice teachers. For this audience, the framework is about teaching and doing data science. They are teaching PSTs and bringing them through the activities that involve doing data science.
The framework (see below) consists of two dimensions:
- DIMENSION 1: Describes the four-component PROCESS for doing data science and consists of the data sciences processes and aligned data science practices. In our DATASETUP modules we want preservice teachers to navigate through the process and practices of doing data science.
- DIMENSION 2: Refers to the pedagogical considerations when planning to engage preservice teachers in a data science activity. This dimension describes the aspects of teaching data science what teacher educators and preservice teachers reflect upon before planning a data science activity and at the completion of a data science activity.

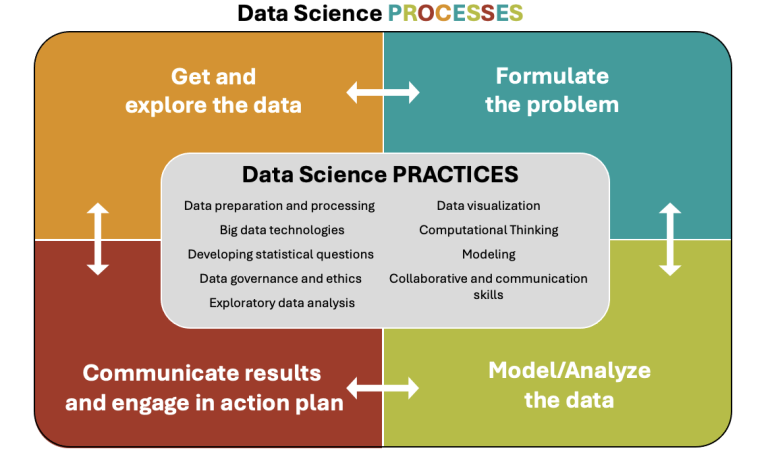
DIMENSION 1: Data science PROCESSES and PRACTICES
The data science process, tailored for pre-service teachers, is a streamlined four component process. Data science is not seen as a cyclical process, but rather as four components that interconnect and do not have a fixed sequential order: Get and explore data – Formulate problem – Model/Analyze data – Communicate results and action plan
The nine data science practices are aligned with the four components of the data science process with many of the practices occurring during all of the processes. The practices focus on how tasks are carried out on a granular level, which techniques and tools are employed, and why certain methodologies may be preferred.
PROCESSES:
- Get and explore the data: This process involves gathering data either firsthand or by sourcing pre-existing data sets (often large and open source). Where pre-existing or secondary data are sourced, exploration of the data set also occurs here to gain insights into the structure of the data (e.g. identification of variables, types of data, distributions, visualizations).
- Formulate the problem: This process involves defining and framing the specific question or problem that the data science project aims to solve. Problem formulation is usually the first step in the data science process which then drives the gathering of data. Teachers, however, often source publicly available data sets for use in classroom contexts and in these situations, problem formulation may occur after the data have been sourced or explored.
- Model/Analyze the data: This process involves exploring data to uncover patterns, trends, and insights relevant to the problem. Where relevant, pre-service teachers are introduced to predictive modeling techniques that can be applied to reveal insights into the data.
- Communicate results and engage in action plan: The final process involves creating a narrative that explains the key findings and subsequently translating these data insights into actionable recommendations for self and society.
PRACTICES:
Data preparation and processing
| …. involves preparing data for analysis. Depending on the structure and source of the data set, this may involve reformatting and cleaning the data to remove duplicates, filling in missing values and remove inaccuracies and inconsistencies in the data, transforming the data by converting data types or deriving new variables, integrating the data to combine data sets. |
Big data technologies
| …. the increasing accessibility and use of big data in schools demands that teachers understand the what of big data and its’ potential to gain deeper insights into issues that are relevant to our world and enhance their data science instruction. For example, knowledge of cloud computing and associated platforms enables teachers to access big data technologies without significant upfront investment in hardware, allowing for more accessible data science projects. |
Developing statistical questions
| … access to open, large, messy and complex data sets poses challenges for the development of research questions that are sufficiently focused and well defined. It can be challenging to formulate questions that can be effectively answered given the available data and that account for the complexity of the data without oversimplifying or overcomplicating the problem. There is also the need to navigate ethical and the broader impacts of the research. |
Data governance and ethics
| ….. where students collect their own data, an understanding of informed consent, anonymization, and respecting participants’ privacy is necessary.When secondary data are sourced, it requires critical evaluation of the sources and consideration of the reliability, biases, and ethical implicationsof using data from different sources. Attention to bias, both their own personal and cultural bias alongside biases inbuilt into data sets is important. The use of open data requires consideration of the ethical implications of using public data.Use of data for social good, for example analyzing public health data or environmental data, can develop appreciation for the projects that use data for positive social impact. |
Exploratory data analysis
| …. involves the selection, calculation and interpretation of appropriate descriptive statistics to summarize and describe the data and correlational analysis to explore relationships within the data. Also requires the use of visualizations and statistical methods to identify patterns, trend and outliersto facilitate understanding of the underlying structure of the data and answer the original question formulated. |
Data visualization
| ….. involves revealing and communicating insights from data through the use of data visualization tools and techniques and also supports the communication of findings. This can be facilitated through the creation and interpretation of basic charts and graphs, pivot tables, and interactive visualizations. |
Computational Thinking
| ….. involves breaking down complex problems into manageable parts, recognizing patterns, and developing algorithms to process and analyze data efficiently. Key practices include decomposition, involving dissecting problems into smaller tasks; pattern recognition, which involves identifying trends or anomalies in data; and abstraction, which focuses on filtering out irrelevant information to highlight core aspects of the data. Additionally, algorithmic thinking is essential for designing step-by-step procedures that enable data analysis, while evaluation involves assessing solutions and refining approaches. Programming languages like Python and R play a crucial role in applying these practices, providing tools and libraries that allow us to automate processes, handle large datasets, and implement complex analyses effectively. |
Modeling
| …. is the process of creating a mathematical representation of a real-world situation using data. A model can be a mathematical equation, a statistical algorithm, or a machine learning algorithm that describes how different variables in the data relate to each other. The development of a model helps capture patterns, relationships, or trends within the data, allowing pre-service teachers to make predictions and inferences and understand underlying processes. |
Collaborative and communication skills
| …. data science is not only a technical field but also one that thrives on effective teamwork and communication. Students equipped with these skills are better positioned to succeed in real-world settings. Consequently, it is essential for teachers to develop students’ collaborative and communication skills in order to prepare them to work with diverse teams, to clearly and concisely communicate findings from complex data sets, to document their data science process, to interact with stakeholders to define project goals and to communicate clearly, to use the language of uncertainty when there is no clear right or wrong and collaborate in making responsible decisions when addressing ethical concerns around data privacy, bias, and fairness in data science projects. |
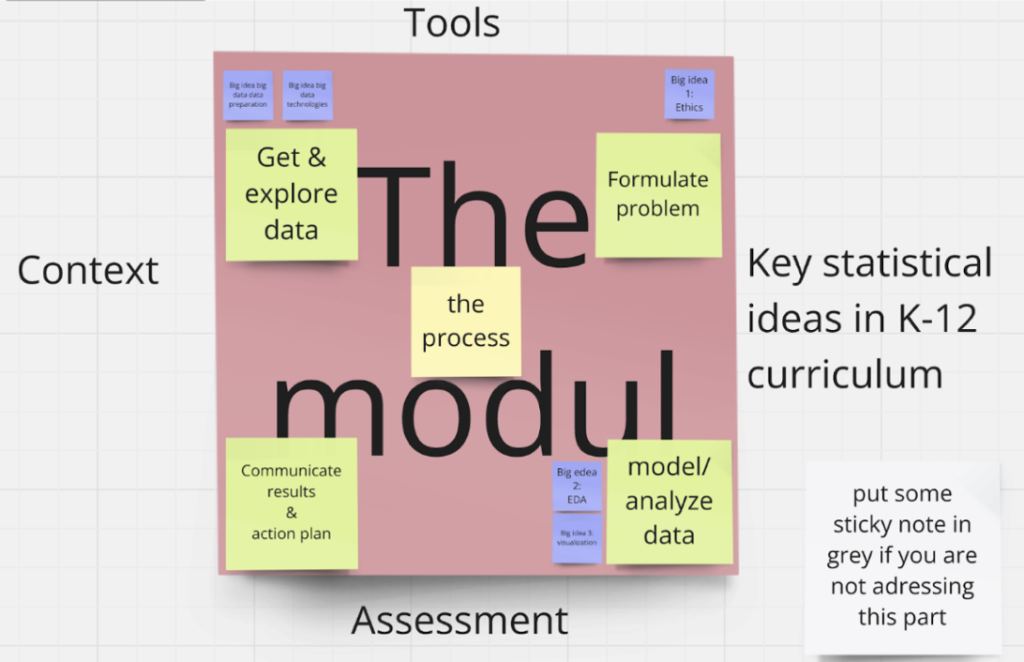
DIMENSION 2: Aspects of teaching data science
This dimension focuses on the pedagogical factors involved in preparing preservice teachers for a data science activity. It highlights the key teaching considerations that both teacher educators and preservice teachers take into account when designing and reflecting on a data science activity, both in the planning stages and after its implementation.
- CONTEXT: The data science modules utilise real-world contexts and scenarios that are engaging and relevant to learners’ everyday lives and help them see the practical applications of data science in various fields. Contexts may draw from sports analytics, environmental data, health and wellness, social media and digital trends, economics, politics and civic data, sustainability, social justice issues, food and agriculture etc.
- KEY IDEAS IN K-12 CURRICULUM: Preservice teachers will be introduced to the key statistical concepts that provide the foundation for the exploratory data analysis practices. These ideas help learners develop the skills necessary to analyze data, make inferences, and draw conclusions and will include key statistics ideas such as understanding data types, data collection and sampling, descriptive statistics, data visualization, distributions, relationships, basic inferential statistics, regressions, predictive modeling, variability and bias etc.
- ASSESSMENT PRACTICES: Assessments evaluate understandings of key concepts, technical skills, and the ability to apply data science methods to real-world problems. They may take many forms, including though not limited to, project-based assessments, report writing, presentations and visualizations, quizzes, data interpretation exercises, portfolios, peer and self-assessments, and rubric-based assessments.
- TOOLS: Depending on the module, a selection of tools may be used from the wide variety of tools and platforms that support data science practices. These tools may be programming languages (for statistical analyses, data visualization etc.), data visualization tools (to construct graphs, interactive visualization etc), data sources that house real-world datasets for machine learning and data analysis, and statistical tools for performing data analysis and visualization.
Refining EDUCATE, the DataSETUP framework
As part of the design research approach that DataSETUP follows, we have refined the EDUCATE framework over the course of the project. Building on the first preliminary sketch, a more structured framework was designed that outlines relevant data science processes and practices as the first dimension of the framework (see below). Since processes and practices are closely intertwined, the latest version of the framework integrates both in a single illustration (see above).

First draft of a preliminary framework
Starting at the end of last year, the team of DataSETUP committed to browse the literature and connect different bits and pieces found in research articles and projects to create the first draft of the preliminary framework for the project that would initiate its iterative (re-)development. What we came up with was the following sketch that illustrates the first draft of the preliminary framework version. Since then, we have run several rounds of redesign. You can see the latest version above.
